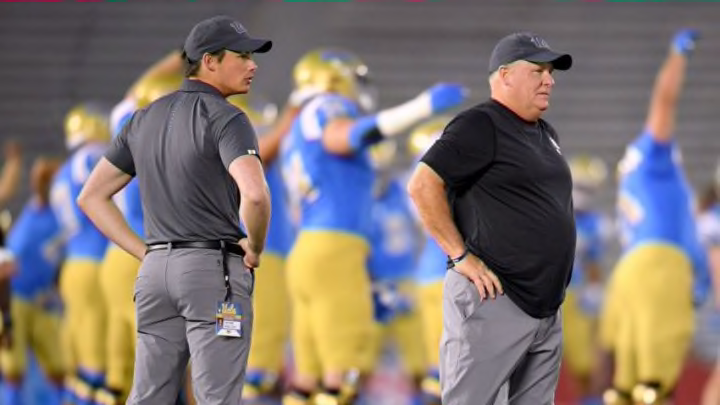
So what do we think of UCLA football head coach Chip Kelly’s offense in his first season with the Bruns? Chris Osgood lays it all out for you.
Before we dive into trying to define the 2018 UCLA football offensive approach, let’s review some of their top-level performance indicators.
RELATED: A Quick Look at UCLA Football’s Recruiting
Overall, they had a 44% run to 56% pass balance. This is probably more passing emphasis than Chip Kelly would prefer and was impacted by being behind most of the time. They passed on 59% (338/575) of the plays they were behind and only passed on 41% (64/156) of plays run while holding a lead. They ran the ball the most (>50% run plays) against Oklahoma, Cal, and USC.
It’s notable that their two most dominant (and fun to watch?) performances on offense (Cal and USC) came when they were able to rely on that run game. They passed the most (67%-70% pass) against Utah (with bad production) and Stanford (good production, at least on offense). The rest of the games were all consistently in the 40% run to 60% pass range. This was a pass first team.


UCLA in 2018 had 5.6 Yards Per Play (YPP), slightly below the national average of 5.7 YPP. This is the 78th nationally ranked YPP. In college football this year, you’d need to be above 6.0 YPP to crack the top 25. For reference, Oklahoma and Alabama ranked #1 and #2 at 8.6 and 7.6 YPP this year.
UCLA in 2018 had a 42% success rate, slightly above the national average success rate of 41%. This is the 73rd ranked success rate nationally. Also for reference, Oklahoma had the best success rate in the nation this year at 55%.
As we go through everything, keep in mind that 5.6 YPP and 42% success rate are the baseline for looking at any feature as a favorable or unfavorable outlier.
