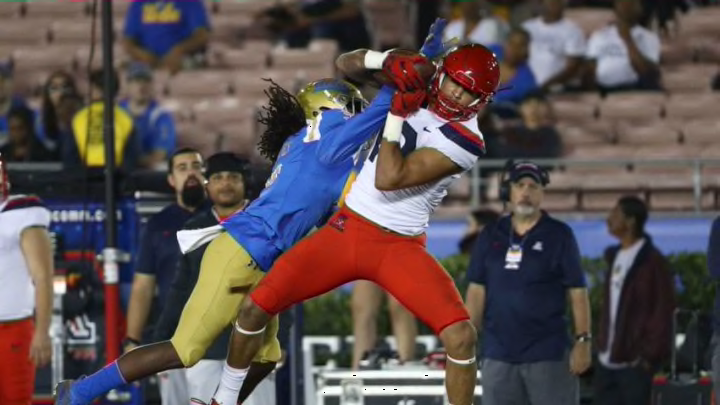
The UCLA football team got their second win of the season against the Arizona Wildcats, but it came at a cost. The cost of key statistics.
The UCLA football is still learning to play as a team and that will cause them to have a lot of growing pains along the way. That was evident in their 31-30 win over lowly Arizona this past weekend.
RELATED: UCLA’s Win Over Arizona Keeps them in the Hunt for the Pac-12 South
After dominating Cal the week prior, UCLA got dominated by Arizona, at least from a statistical perspective. The Bruins managed to pull out the win, but it revealed a few key weaknesses. Let us see how the Bruins did against the Wildcats.
Total Offensive Yards:
Season Avg (Nat’l Ranking): 354.0 (99th) | Vs. Arizona: 480
When Dorian Thompson-Robinson went down, the Bruins adjusted to accommodate Wilton Speight and went pass-heavy. The thing about this was, UCLA was already slinging the ball around. UCLA’s run game did what they always do but the passing yards that it produced skyrocketed. Though Chip Kelly wants to run the ball, his team is having success through the air. Hey, whatever works!
Offensive Rushing Yards
Season Avg (Nat’l Ranking): 150.4 (84th) | Vs. Arizona: 153
Joshua Kelley had his fourth game gaining over 100-yards, a feat in and over itself. The only bad thing about the run game as a whole is that they did not make any progress this season. Before this game, Arizona gave up over 200 yards on the ground. UCLA did not capitalize on that, which would have helped the offense overall. Maybe next game.
Offensive Passing Yards
Season Avg (Nat’l Ranking): 203.6 (93rd) | Vs. Arizona: 307
The thing about this stat was UCLA was already slinging the ball around before DTR exited the game with an injury. DTR had 103 yards through a quarter and a half. Speight built on that with 204 yards of his own. Going forward, if Speight is in the game, I would expect the Bruins to go pass-heavy, but at the same time, who knows what Kelly has planned for this team. We seem to be surprised every game.
Scoring Offense (Points)
Season Avg (Nat’l Ranking): 22.9 (99th) | Vs. Arizona: 31
The good thing about UCLA is that they are getting more comfortable with their offense, no matter how many little steps back they take, which is resulting in more points. For the second game in a row, they scored over 30 points. That is something we will take, especially if the defense can limit the opposition’s scores. About that…
Total Defensive Yards:
Season Avg (Nat’l Ranking): 426.4 (91st) | Vs. Arizona: 520
This is what we call in the business a “No Bueno”. UCLA has been holding their own against good offensive teams this season, which is why this stat is such a head-scratcher. Arizona made the Bruins’ defense look like one that was led by Tom Bradley and not Jerry Azzinaro. As aggressive as the Bruins have been this season, they were not as aggressive in this game. That was evident in the fact that they only got one tackle for a loss against the Cats.
Defensive Rushing Yards
Season Avg (Nat’l Ranking): 193.6 (94th) | Vs. Arizona: 289
We have no idea what happened to the Bruins’ run defense. They have made huge improvements, but this is one performance to forget about. Actually, the Bruins should not forget about it. They should pin this number on their lockers as a reminder of what not to do. There were so many holes in the defensive line that they could have been solid as jeans at Forever 21 for the price of $289.
Defensive Passing Yards
Season Avg (Nat’l Ranking): 232.7 (69th) | Vs. Arizona: 231
The Bruins were just under their average in this department. Not horrible, but not a great improvement either. The one thing that saved the pass defense was the key interceptions by Quentin Lake (in the end zone) and Elijah Gates. At that point, I will take those numbers. I just hope they improve as the season goes on.
Scoring Defense (Points)
Season Avg (Nat’l Ranking): 31.3 (86th) | Vs. Arizona: 30
Again, UCLA’s defense held back Arizona just enough to get the win. After shutting down Cal for only 7 points in the prior week, it was a bit of a shock to see Arizona in the end zone as much as they did. Still, it could have been worse. Bless you, Darnay Holmes!
