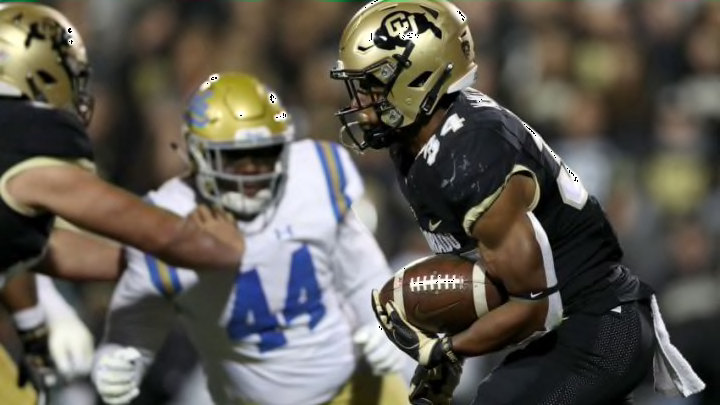
The UCLA football team made some improvements against Colorado, but they also took a few steps back in the second half. Here is what the statistical progress looked like (if you can call it that).
It is unfortunate that this Go Joe Bruin segment is called “Statistical Progress” because there was not a lot of progress in UCLA football’s loss to Colorado.
RELATED: UCLA Football – The Best-Laid Plans of Mice and Bruins…
The offense looked better for a half, especially the run game which made several improvements. Unfortunately, that was about all the progress the Bruins could muster up.
Total Offensive Yards:
Season Avg (Nat’l Ranking): 312.0 (115th) | Vs. Colorado: 289
The Bruins looked like they were going to shatter this statistic as they accumulated 191 yards in the first half alone. Unfortunately, the Bruins did very little to keep up the good work in the second half. It also did not help that UCLA had several three and outs, giving Colorado the ball for the majority of the game. Ready for another bad stat? Colorado had the ball for 34:47. UCLA only had it for 25:13. Yikes.
Offensive Rushing Yards
Season Avg (Nat’l Ranking): 135.8 (96th) | Vs. Colorado: 151
There was so much happiness coursing through my veins when I saw the Bruins have a running game to write home about. Yes, it faded in the second half, but the point is there was something there. Joshua Kelley got the call most of the game as he ran for 124 yards and averaged 10.3. There are always silver linings.
Offensive Passing Yards
Season Avg (Nat’l Ranking): 176.2 (105th) | Vs. Colorado: 138
But there are no silver linings in the passing game. This was not a good outing for young Dorian Thompson-Robinson. Once again, there were good things flowing from the Bruins in the first half as DTR threw for 96 yards before halftime, but only getting 42 in the second half is troubling. He was not sharp and was missing on his passes which really hampered the “progress”.
Scoring Offense (Points)
Season Avg (Nat’l Ranking): 17.0 (119th) | Vs. Colorado: 16
At least UCLA knows they still have JJ Molson to count on when they cannot get in the end zone. After DTR connected with Michael Ezeike in the first quarter to put UCLA up 7-0, they could only get close enough to give Molson a chance to get points. He did not see any more time on the field after his third early in the third quarter as the Bruins could not get him close enough to be effective.
Total Defensive Yards:
Season Avg (Nat’l Ranking): 423.0 (85th) | Vs. Colorado: 477
When the offense is on and off the field in the blink of an eye, that will not give the defense enough time to rest. That was once against the case against Colorado who exploited the Bruins’ weaknesses and weakened state UCLA was exhausted in the second half.
Defensive Rushing Yards
Season Avg (Nat’l Ranking): 184.5 (86th) | Vs. Colorado: 209
When you can’t tackle, you are going to give up a lot of yards. UCLA had trouble tackling and they gave up a lot of yards. I keep replaying in my head the potential sack on Steven Montez in the second half that he escaped from and turned into a first down. That pretty much summed up UCLA’s night.
Defensive Passing Yards
Season Avg (Nat’l Ranking): 238.5 (79th) | Vs. Colorado: 268
One thing UCLA knew to do and did not, was limit Laviska Shenault’s touches and yards. That did not happen. Giving up a 57-yard passing touchdown early in the game was not a good tone to set for the defense. It got worse in the second half as Montez and Colorado did whatever they wanted against the Bruins.
Scoring Defense (Points)
Season Avg (Nat’l Ranking): 37.8 (109th) | Vs. Colorado: 38
At least this was not as bad as it could have been. If UCLA did not have such a good first half, they would have given up a lot more points. Limiting Colorado to 14 in the first half was progress. Giving up 24 in the second half is not.
