Go Joe Bruin Bracketology – Week 4

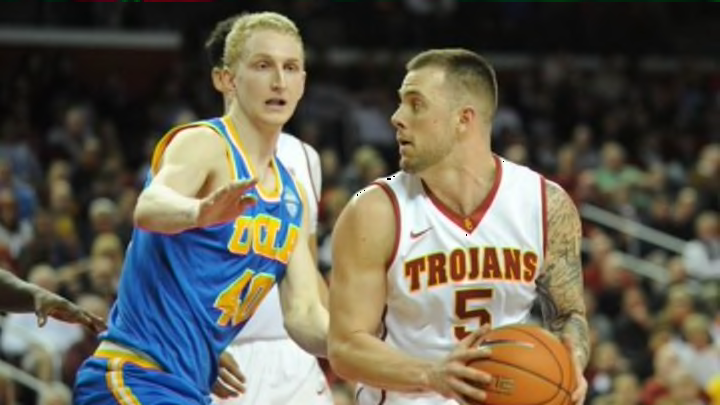
February 4, 2016; Los Angeles, CA, USA; Southern California Trojans guard Katin Reinhardt (5) moves the ball against UCLA Bruins center Thomas Welsh (40) during the second half at Galen Center. Mandatory Credit: Gary A. Vasquez-USA TODAY Sports
February 4, 2016; Los Angeles, CA, USA; Southern California Trojans guard Katin Reinhardt (5) moves the ball against UCLA Bruins center Thomas Welsh (40) during the second half at Galen Center. Mandatory Credit: Gary A. Vasquez-USA TODAY Sports /
facebooktwitterreddit
Prev
4 of 5
Next
Feb 10, 2016; Salt Lake City, UT, USA; Washington Huskies forward Malik Dime (10) and forward Marquese Chriss (0) react during the second half against the Utah Utes at Jon M. Huntsman Center. Utah won 90-82. Mandatory Credit: Russ Isabella-USA TODAY Sports
Feb 10, 2016; Salt Lake City, UT, USA; Washington Huskies forward Malik Dime (10) and forward Marquese Chriss (0) react during the second half against the Utah Utes at Jon M. Huntsman Center. Utah won 90-82. Mandatory Credit: Russ Isabella-USA TODAY Sports /

Bubble Watch

Blind résumé time! Below are the résumés of four bubble teams, with the identity of each team hidden. Only of the four teams are projected to be in the tournament.

The formula ranked these teams, from best to worst: C, A, D, B

These teams’ identites: A-Texas Tech, B-Washington, C-Tulsa, D-Vanderbilt

Here’s a magnified look at the “bubble,” a term I use generously because it was expanded to include everyone down to UCLA, who is the 13th team out. To make it easier to navigate through the maze of numbers, each number has been color-coded. The greener a square is, the stronger the team is in that statistic. The redder a square is, the weaker the team is in that statistic.

A closer look at 21 bubble teams. Green squares are a team's strengths, red squares are a team's weaknesses. Teams above the black line are projected to make the tournament.
Click the image to enlarge. A closer look at 21 bubble teams. Green squares are a team’s strengths, red squares are a team’s weaknesses. Teams above the black line are projected to make the tournament. Credit: Jake Liker /

The Bruins have a lot of red and orange here, especially in the win-loss column. That certainly explains why UCLA has fallen so far.

Next: UCLA outlook